The following page guides you step by step to create your first data quality indicators, but first you need to setup your instance of MobyDQ. Refer to the page Getting Started to get it up and running. Once your instance is up, open a new browser window and navigate to MobyDQ. You can connect on the first time with the user admin and password admin.
Create Data Sources
Data sources are systems containing or exposing data such as relational databases or APIs. The first step is to create at least one data source to which MobyDQ will connect to compute indicators. In this example we will create two data sources, one MySQL database and one Cloudera Hive database. You can actually run these two data sources directly on your machine using the following command.
# Go to repository root
$ cd mobydq

# Build Docker images for both data sources
$ docker-compose -f docker-compose.yml -f docker-compose.test.yml build db-mysql db-cloudera

# Run Docker containers for both data sources
$ docker-compose -f docker-compose.yml -f docker-compose.test.yml up -d db-mysql db-cloudera
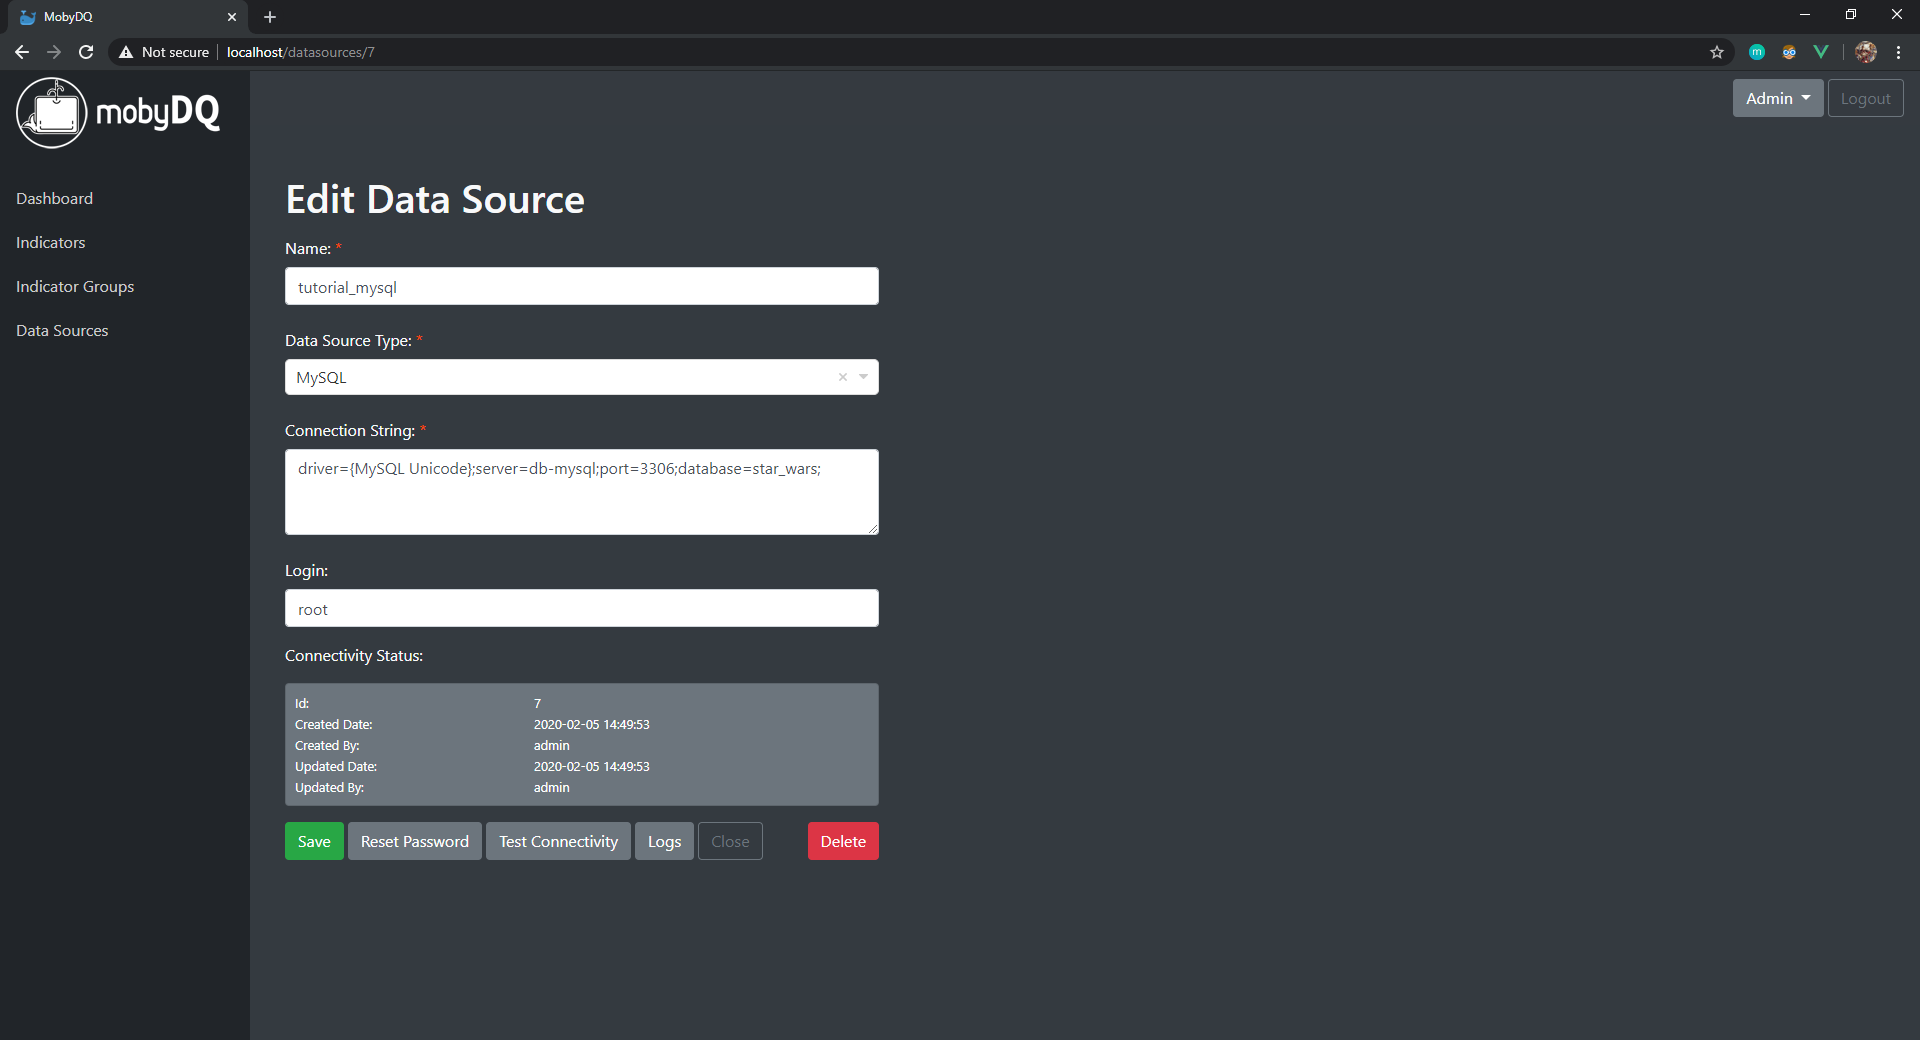
Create MySQL Data Source
- In the web application in the menu on the left, click on “Data Sources”. This takes you to the list of existing data sources.
- Click on the button “Create Data Source”. This takes you to the new data source form.
- Fill in the form with the following information and click on the button “Save”.
- Name (must be unique):
tutorial_mysql - Data Source Type:
MySQL - Connection String:
driver={MySQL Unicode};server=db-mysql;port=3306;database=star_wars; - Login:
root - Password:
1234
- Name (must be unique):
- Click on the button “Test Connectivity” to confirm the connection is working.
- If the test fails, click on the button “Logs” to see the error message.
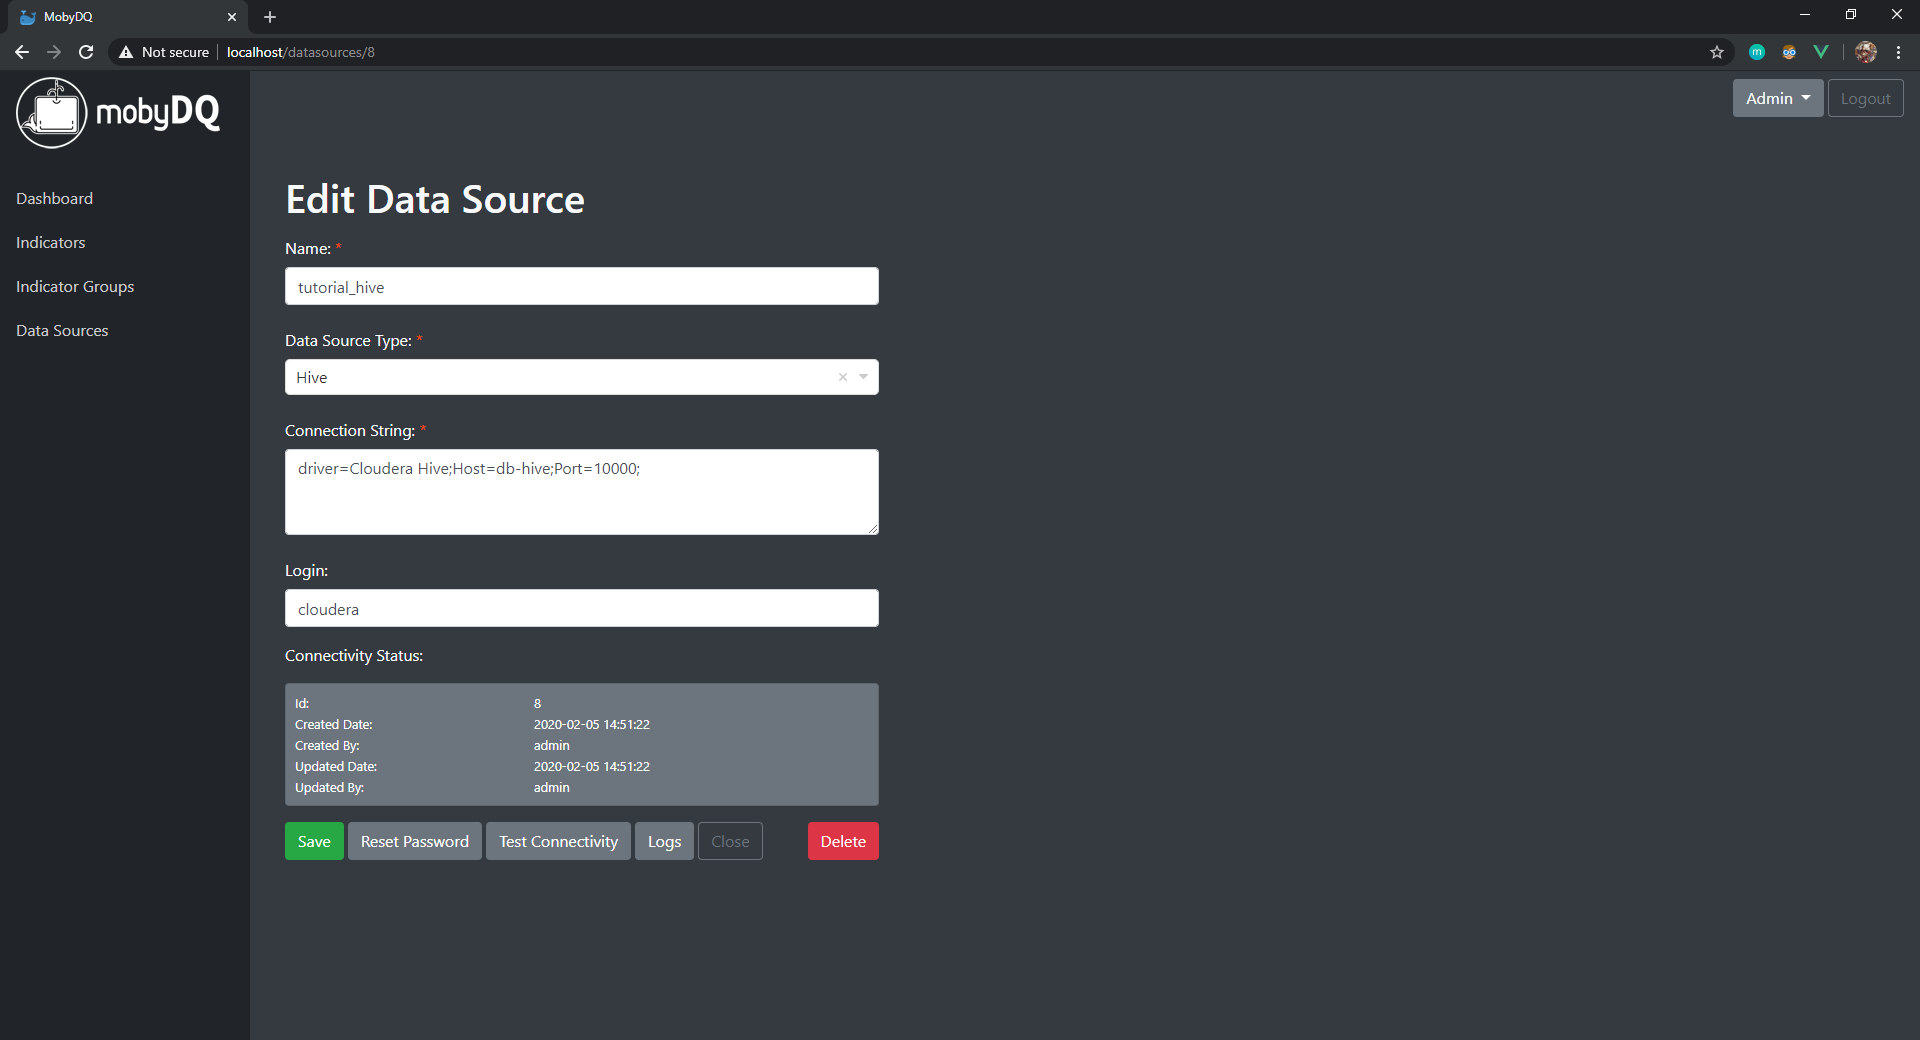
Create Cloudera Hive Data Source
- Follow the same steps as for the MySQL data source above.
- Fill in the form with the following information and click on the button “Save”.
- Name (must be unique):
tutorial_hive - Data Source Type:
Cloudera Hive - Connection String:
driver=Cloudera Hive;Host=db-cloudera;Port=10000; - Login:
cloudera - Password:
cloudera
- Name (must be unique):
Note: Connection to Cloudera Hive databases is done using Cloudera Hive ODBC driver.
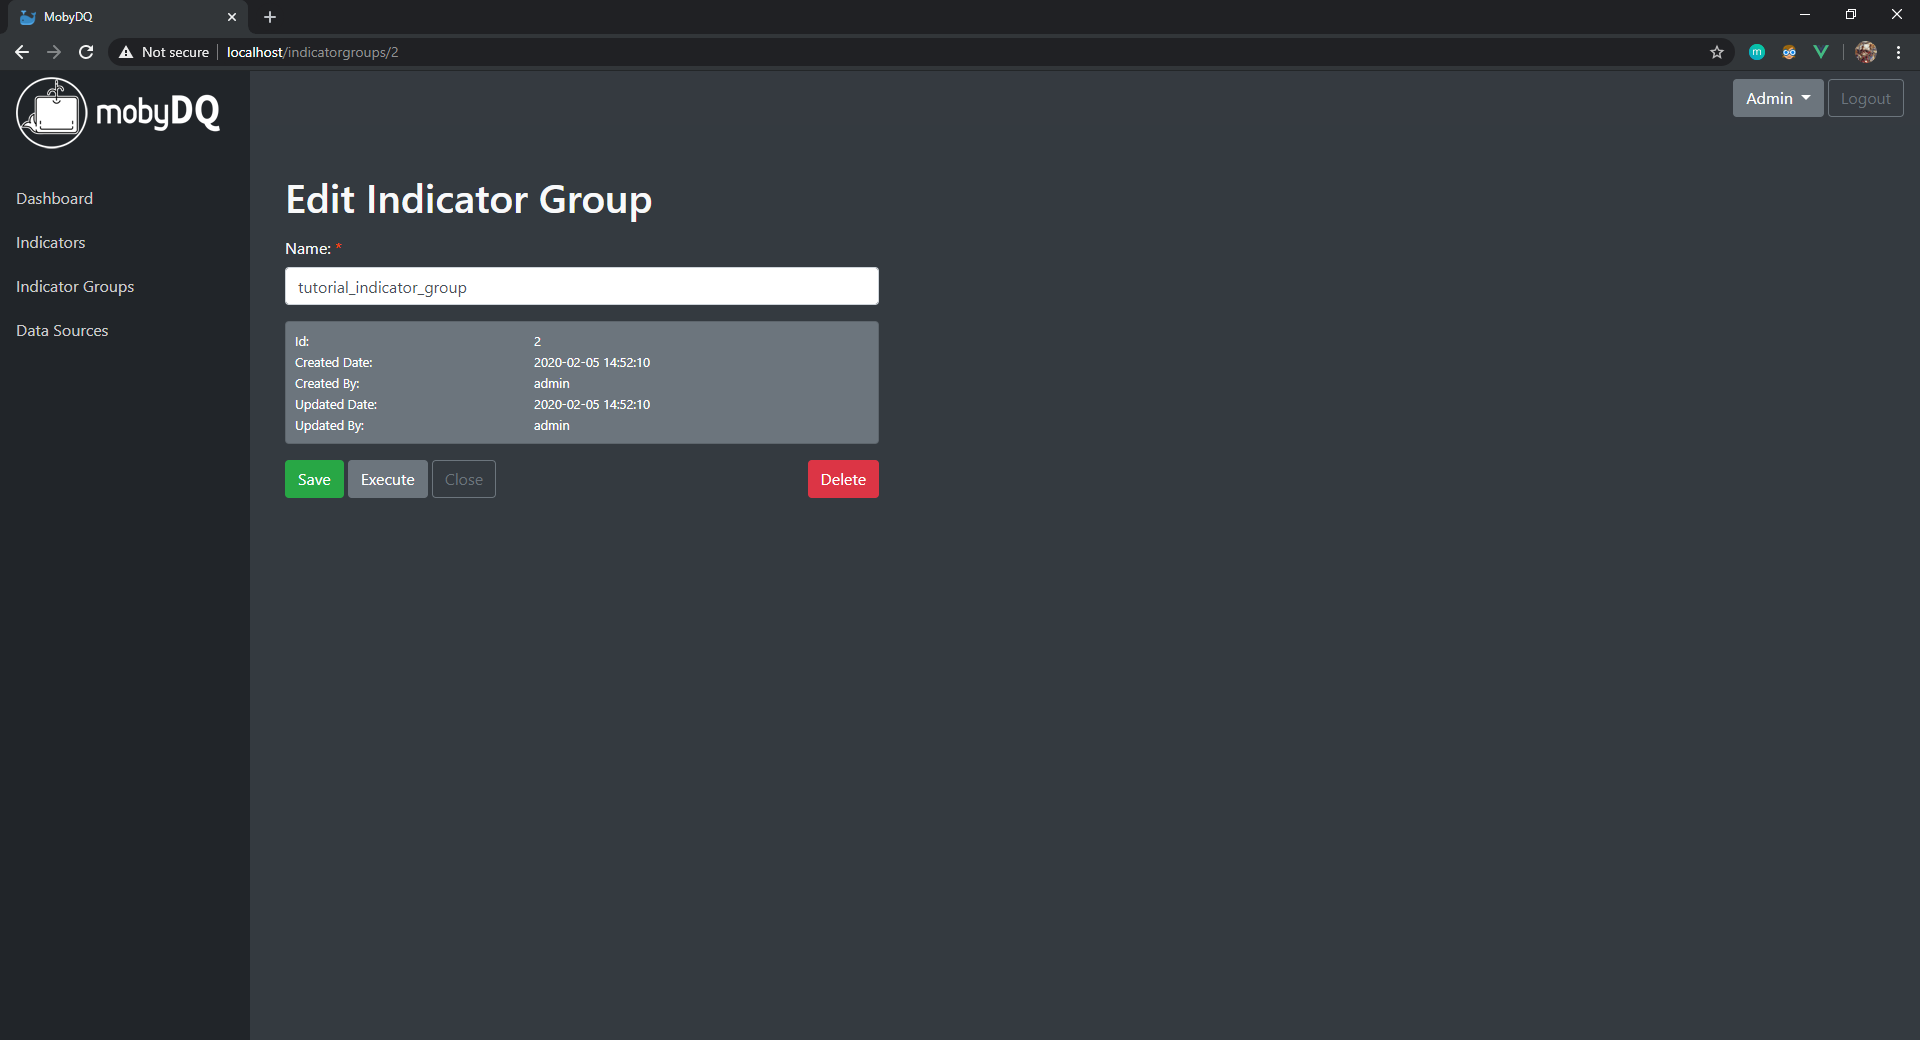
Create Indicator Group
An indicator group is a collection of indicators. It can be used to trigger the execution of multiple indicators in a single batch.
- In the menu on the left, click on “Indicator Groups”. This takes you to the list of existing indicator groups.
- Click on the button “Create Indicator Group”. This takes you to the new indicator group form.
- Fill in the form with the following information and click on the button “Save”.
- Name (must be unique):
tutorial_indicator_group
- Name (must be unique):
Create Indicators
Indicators compute datasets on one or several data sources in order to evaluate their data quality. See the definition of each indicator type in the page: Indicators.
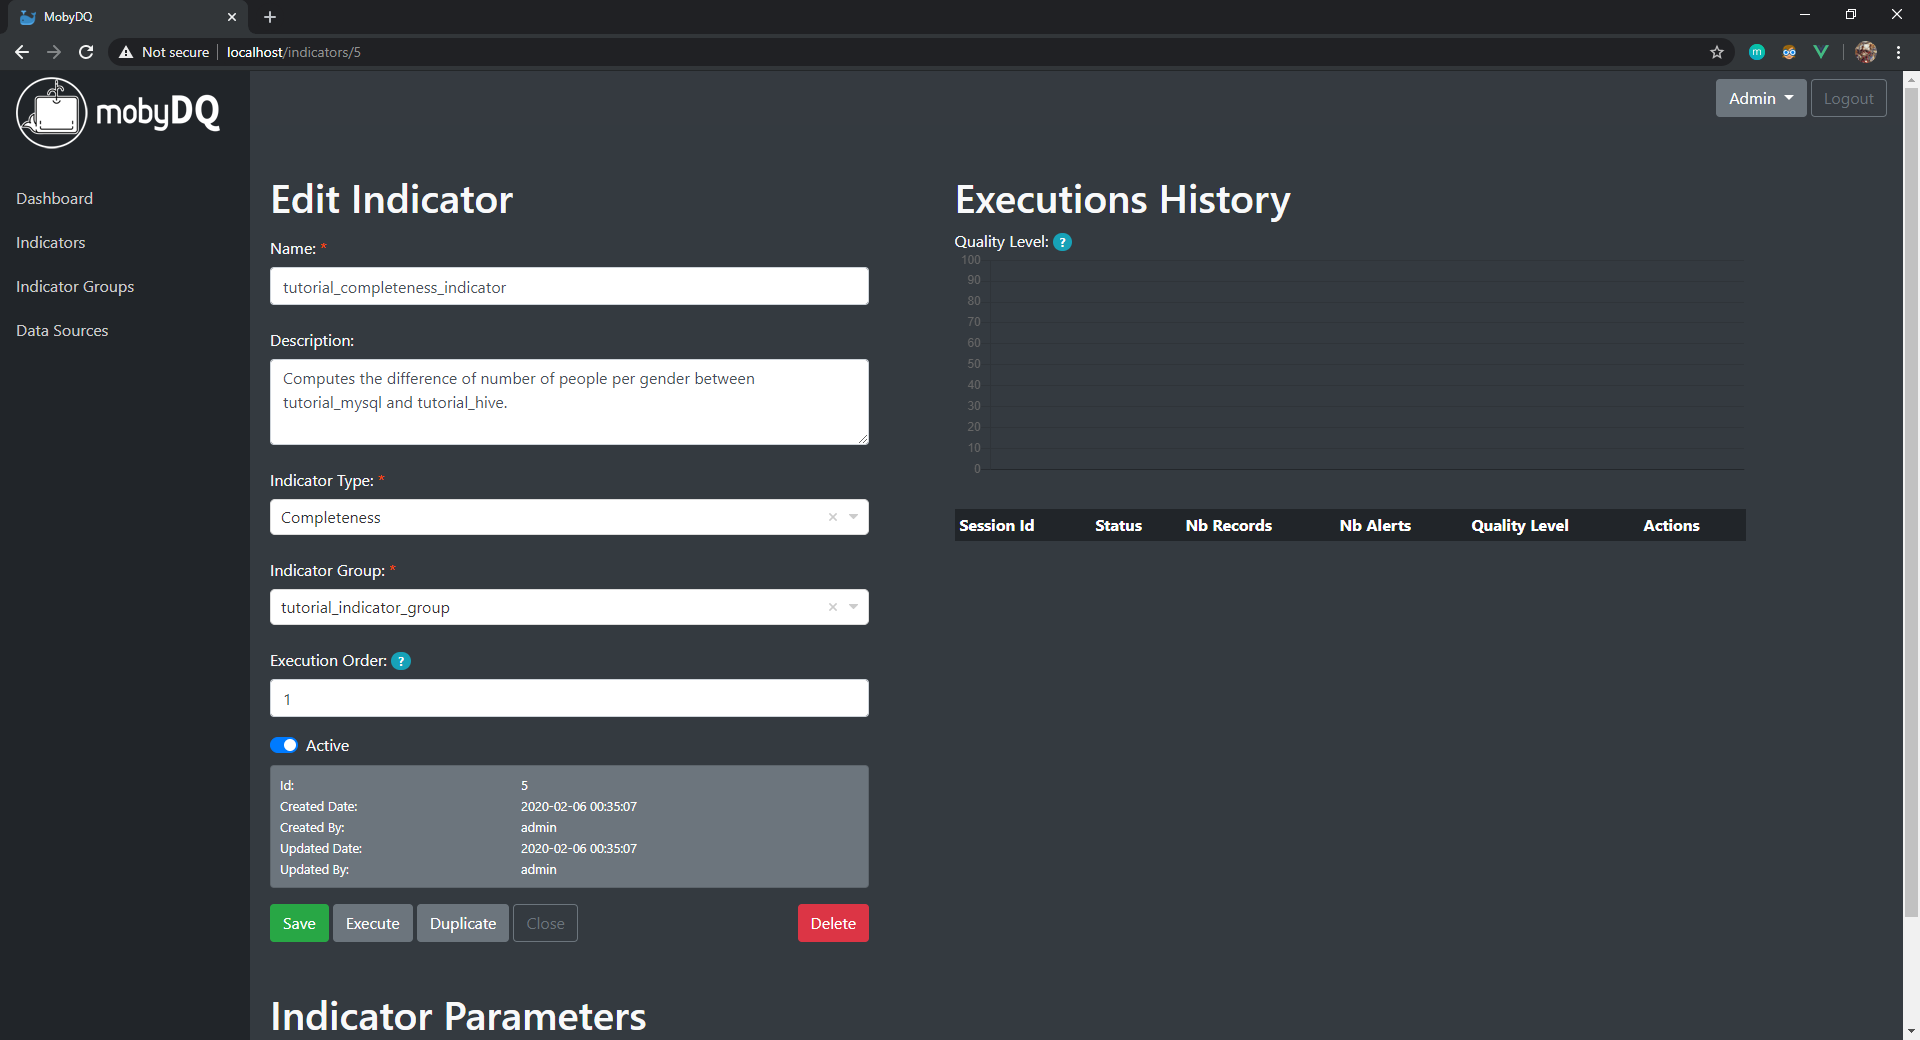
Create Completeness Indicator
- In the menu on the left, click on “Indicators”. This takes you to the list of existing indicators.
- Click on the button “Create Indicator”. This takes you to the new indicator form.
- Fill in the form with the following information and click on the button “Save”.
- Name (must be unique):
tutorial_completeness_indicator - Description:
Computes the difference of number of people per gender between tutorial_mysql and tutorial_hive. - Indicator Type:
Completeness - Indicator Group:
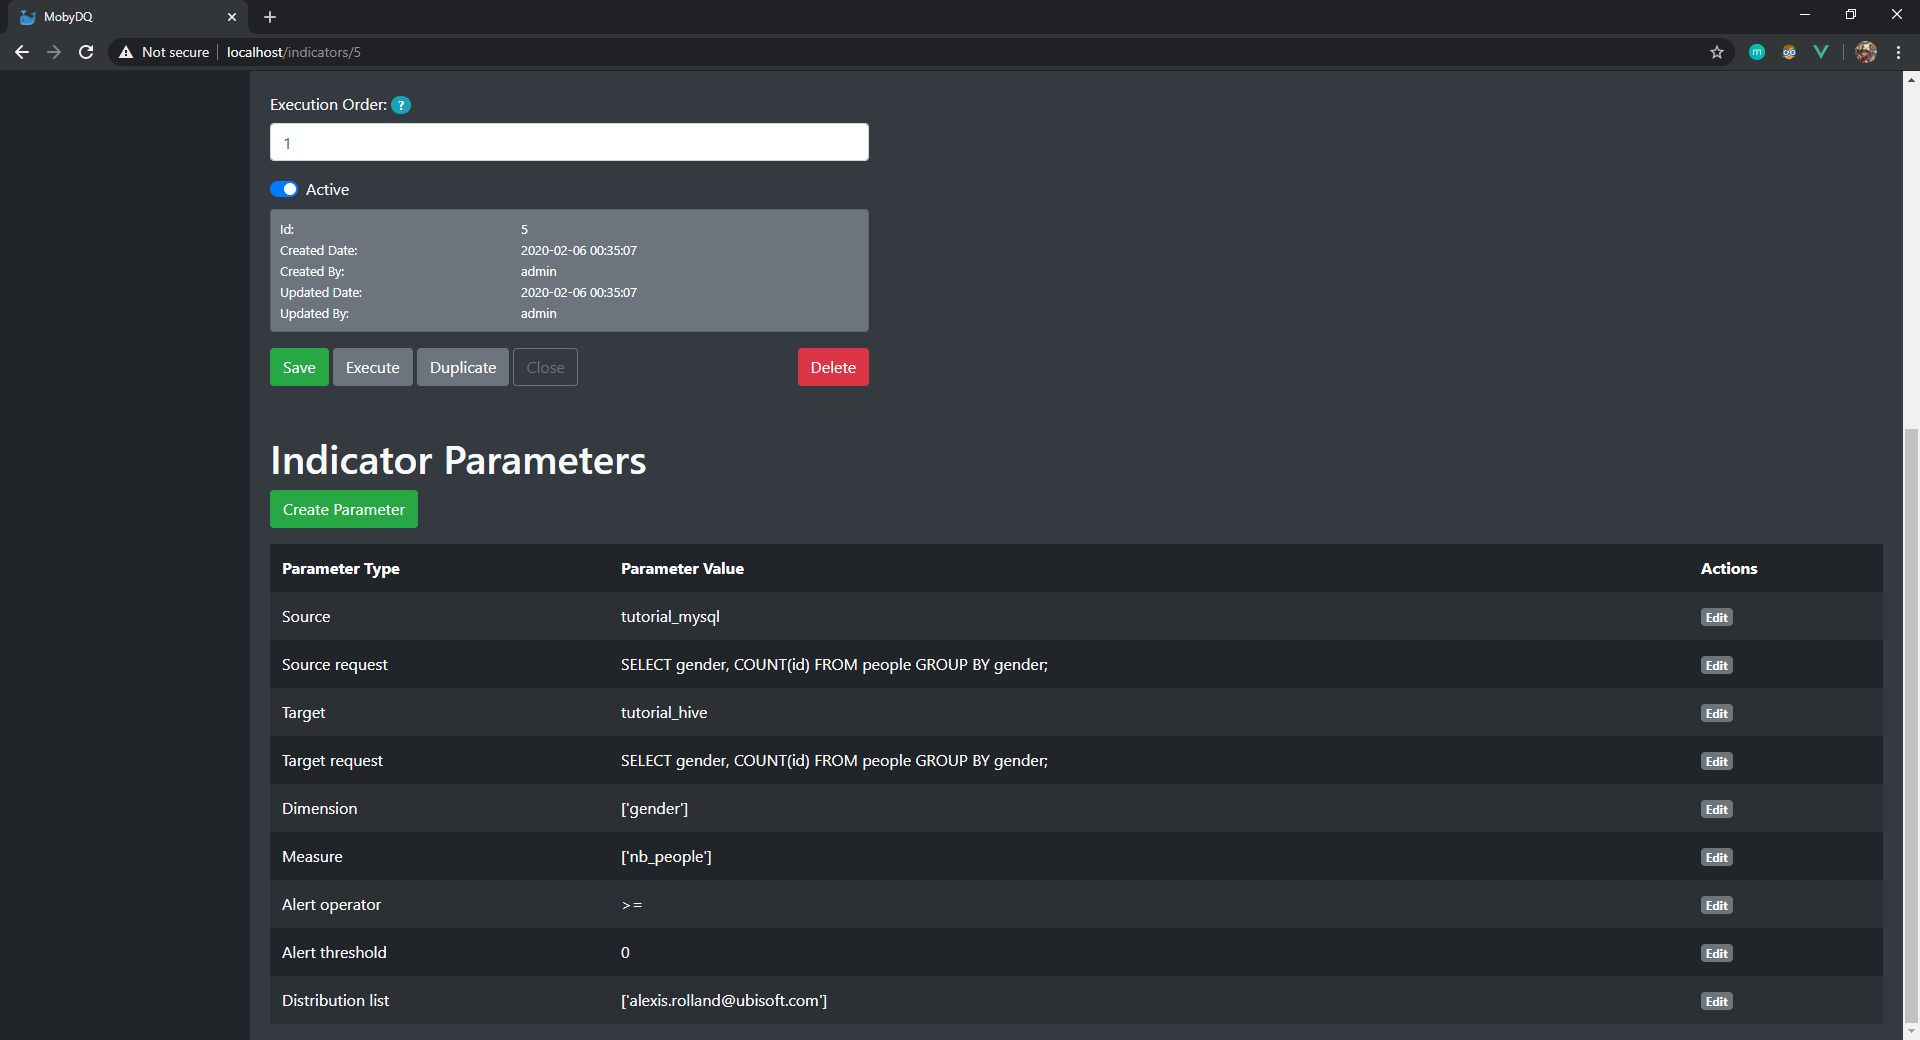
tutorial_indicator_group - Execution Order:
1 - Active:
true
- Name (must be unique):
The next steps is to create parameters used during the execution of the indicator. For each of the parameter below, click on the button “Create Parameter” and fill in the form as described below.
Source Parameters
- Source:
tutorial_mysql - Source request:
SELECT gender, COUNT(id) FROM people GROUP BY gender;
MobyDQ will connect to the data source tutorial_mysql and will execute the SQL statement in source request parameter. It returns a dataset with the following structure.
| gender | COUNT(id) |
|---|---|
| female | 19 |
| hermaphrodite | 1 |
| male | 62 |
| n/a | 3 |
| none | 2 |
It is mandatory for the SQL statement to return a dataset structured with dimension columns in first position (aka group by columns) and measure columns in second position.
-- This is OK
SELECT country, item, COUNT(id), SUM(amount) FROM sales GROUP BY country, item;

-- This is NOT OK
SELECT country, COUNT(id), item, SUM(amount) FROM sales GROUP BY country, item;

-- This is NOT OK
SELECT COUNT(id), SUM(amount), country, item FROM sales GROUP BY country, item;
Target Parameters
- Target:
tutorial_hive - Target request:
SELECT gender, COUNT(id) FROM people GROUP BY gender;
MobyDQ will connect to the data source tutorial_hive and will execute the SQL statement in target request parameter. In this example the SQL statement is the same as the source request so it will return the same dataset.
The SQL statement must follow the same rules as described for the source request, dimension columns in first position (aka group by columns) and measure columns in second position. The target dataset must also have the exact same number and order of dimensions and measures as the source dataset, so that both datasets can be compared.
Dimension & Measure Parameters
- Dimension:
['gender'] - Measure:
['nb_people']
MobyDQ will combine both the source and target datasets doing a full join on dimensions. In the context of our example, the combined dataset produced after the full join looks like this.
| gender | nb_people_source | nb_people_target |
|---|---|---|
| female | 19 | 19 |
| hermaphrodite | 1 | 1 |
| male | 62 | 62 |
| n/a | 3 | 3 |
| none | 2 | 2 |
The datasets must be structured with dimensions in first position and measures in second position because MobyDQ uses the dimension and measure parameters to understand which column is what. A more complex example could look like this: SELECT country, item, COUNT(id), SUM(amount) FROM sales GROUP BY country, item;
Dimension and measure parameters in this case could be:
- Dimension:
['country', 'product'], dimension length is 2, this means the 1st and 2nd columns of the datasets are dimensions. Column names will also be renamed with the aliasescountryandproduct. - Measure:
['quantities', 'amount'], measure length is 2, this means the 3rd and 4th columns of the datasets are measures. Column names will also be renamed with the aliasesquantitiesandamount.
Alerting Parameters
- Alert operator:
>= - Alert threshold:
0 - Distribution list:
['name@company.com']
The alert operator is combined with the alert threshold parameter and used to compare the source and target datasets. For each measure and each record of the combined dataset, MobyDQ computes the difference in percentage and compares its absolute value with the alert threshold.
|(Target Measure - Source Measure) / Source Measure| >= 0
If the expression returns true, an e-mail alert is sent to the distribution list with the combined dataset and evaluation results included in attachment. In the context of our example, the indicator will always trigger an alert because there is not difference between the source and target datasets and the alert condition is >=0.
| gender | nb_people_source | nb_people_target | nb_people_delta | nb_people_delta_percentage | Alert |
|---|---|---|---|---|---|
| female | 19 | 19 | 0 | 0 | TRUE |
| hermaphrodite | 1 | 1 | 0 | 0 | TRUE |
| male | 62 | 62 | 0 | 0 | TRUE |
| n/a | 3 | 3 | 0 | 0 | TRUE |
| none | 2 | 2 | 0 | 0 | TRUE |
Create Freshness Indicator
To be documented
Create Latency Indicator
To be documented
Create Validity Indicator
To be documented